SOUTH DARLOT GOLD PROJECT (
The Company’s
The British King Mine which is 49% owned by the Company and which is National Instrument 43-101 – Standards of Disclosure for Mineral Projects (“NI43-101”) compliant.The British King Mine is 5km southwest of Red 5 Limited’sDarlot Mine .The British King Mine is currently in care and maintenance.- A number of tenements which are subject to a joint venture with subsidiaries of Red 5 Limited (“Red 5”), details of which are set out below, in which CIO has earned a 70% interest.
Figure 1: Locality map of the South Darlot project
RED 5
The tenements set out in the table below (“Red 5 JV Tenements”) are the subject of a joint venture between the Company and subsidiaries of Red 5 Limited (“Red 5 JV”) and are situated southwest of Red 5’s Darlot gold mine and are contiguous with CIO’s current holdings in the area. The Red 5 JV Tenements are detailed below.
Table 1: List of South Darlot tenements
| Project | Tenement | Status | Area (ha) |
| Barrick JV | M37/421 | Granted | 381 |
| Barrick JV | M37/552 | Granted | 200 |
| Barrick JV | M37/631 | Granted | 776 |
| Barrick JV | M37/632 | Granted | 595 |
| Barrick JV | M37/709 | Granted | 98 |
| Barrick JV | M37/1045 | Granted | 90 |
Focus of Sampling and recent multi-element analysis
Following the success of the Phase 1 soil sampling campaign over the
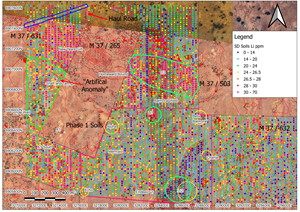
A total of 3,864 samples were collected across an area of 3.2 km2. Sieved samples 200 – 300 grams in weight were collected from each location and sent to
As per the previous soil sampling campaign, a tight sample density (20m northing x 30m easting) was employed to better identify other potential systems with a similar footprint of
Recent multi-element and petrographic analysis of the mineralisation at the Endeavour Prospect revealed there is a base metal associated with the Au enriched vein. Cu, Pb and low levels of Ag were present in said test work, which were used as a guide when discriminating higher rank anomalous targets when these elements were found to be spatially coincident to Au.
Soil Geochemistry Results
During the soil sampling campaign, a region containing battery sands was identified on the western flank of the samples area. This area was identified post sample collection and was further validated by field reconnaissance completed by a Field Geologist. When the assays were returned, this area was highlighted to be extremely anomalous, however the samples were chosen to be omitted from the analysis due to their biased results. The results have been omitted from all images presented in this release.
Eight (8) new areas have been highlighted as prospective for Au and require further investigation.
Coupled with the Phase 1 soils campaign, a total of thirteen (13) targets have been generated from the soil sampling campaigns completed in the South Darlot region. Several of the new targets are coincidental with historically mined (early 1900’s) locations. Further analysis of the South Darlot geology database show that these historically mined locations have minimal to no below surface definition and therefore should be focused on with either Aircore (AC) or Reverse Circulation (RC) drilling. All new locations highlighted by the Phase 2 soils campaign show to have coincidental elevated pathfinder elements such as Cu, Pb, Bi, Co, As, Ag, Sb and Te to Au.
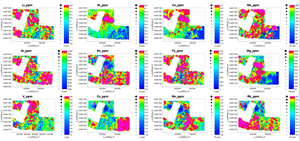
Figure 2. Au (ppb) dispersion in the
Figure 3. Screengrab of ioGASTM observing Au and its correlation with base metal and other Au pathfinder elements. Red – Known mineral deposits, Yellow – Phase 1 Prospective areas for Au exploration, Purple – Phase 2 Prospective areas for Au exploration.
One (1) new area was highlighted as prospected for Li exploration. Li3 exhibits a reasonable correlation between Li and Ta, V, but shows a strong correlation with Ni, Co, Al, Mg and Pt, Pd. Cs and Ta generally show low levels which is does not support the theory of an LCT pegmatite within Li3, however there may still be a source for lithium if the presence of pegmatites can be found within the metagabbro.
As Li3 is located within close proximity to the
Figure 4. Li (ppm) dispersion in the
Figure 5. Screengrab of ioGASTM observing Li with respect to LCT Pegmatite pathfinders. Green – Prospective areas for Li/LCT Pegmatite exploration.
Q3-Q4 Planned Drilling of Identified Targets
An AC programme consisting of 56 holes for 3,920m is already planned in the South Darlot region to test the five (5) targets from the Phase 1 soil sampling campaign. This is planned in Q3-Q4 of 2023. A systematic approach has been planned to test these regions and may change in the field during drilling, based on intersected domains. It is interpreted that the mineralising structures dip at varying angles towards the south, so a broad northern dipping programme is likely to intersect potential mineralising structures.
Figure 6. 23 South Darlot AC Programme, highlighting previous drilling (green crosshairs) and locations of known mineralisation.
Design work for the drilling of the Phase 2 Soils campaign targets is still underway. As most targets identified have shown some evidence of economic mineralisation (historic workings) RC drilling will occur to collect a more representative sample and to better define the potential mineralisation and voids of the area. Most of the drilling will be designed to intersect potential mineralisation within the transitional domain, as it is likely that mineralisation in the South Darlot region all exhibit a typical supergene environment, similar to what has been identified from the drilling at the
Endeavour Toll Treatment Test work.
In
Some key findings from the test work are:
- Very low levels of all deleterious elements (As, Sb, Bi, Te, Cu, Pb and Hg).
- Good agreeance between BLEG, FA and bottle roll recalculate grades for two presented composites.
- All composites were highly amenable to Gravity/Cyanidation.
- Gravity recovery was considered good, averaging 48.6%
- Overall extraction for composites averaged at 99.2% recovery. Composites exhibited excellent leaching kinetics, with leaching being near/at completion in eight (8) hours.
- Rheology test work were pumpable at all tested conditions.
- Comminution test work showed that the
Endeavour ore are within specifications for toll treatment facilities and are below penalty thresholds.
Figure 7. Left image – microscopy photo of panned Knelson concentrate. Right image – HG composite Panned Knelson concentrate. Seen in the images are the grains of visible gold, electrum, and copper bearing minerals, likely covellite, malachite and azurite. Copper minerals are in generally low abundance and not deleterious to recovery.
QUALIFIED PERSON
Mr
On behalf of the Board of Directors
“David Deitz”
____________________________
For further information, please contact:
www.centralironorelimited.com
Investor and Media Inquiries:
Direct: +61 2 9397 7521
Email:info@centralironore.com
Neither the
THIS NEWS RELEASE IS NOT FOR DISTRIBUTION TO
Cautionary Note Regarding Forward-Looking Statements
This news release contains forward-looking information within the meaning of Canadian securities laws. Although the Company believes that such information is reasonable, it can give no assurance that such expectations will prove to be correct. Forward-looking information is typically identified by words such as: believe, expect, anticipate, intend, estimate, postulate and similar expressions, or are those, which, by their nature, refer to future events. The Company cautions investors that any forward-looking information provided by the Company is not a guarantee of future results or performance, and that actual results may differ materially from those in forward looking information as a result of various factors, including, but not limited to, the state of the financial markets for the Company’s equity securities, the state of the market for iron ore or other minerals that may be produced generally, recent market volatility; variations in the nature, quality and quantity of any mineral deposits that may be located, the Company's ability to obtain any necessary permits, consents or authorizations required for its activities, to raise the necessary capital or to be fully able to implement its business strategies and other risks associated with the exploration and development of mineral properties. The reader is referred to the Company's disclosure documents for a more complete discussion of such risk factors and their potential effects, copies of which may be accessed through the Company’s page on SEDAR at www.sedar.com.
Figures accompanying this announcement are available at:
https://www.globenewswire.com/NewsRoom/AttachmentNg/b4c0f796-31d6-4a57-a379-c182d0f1f6d1
https://www.globenewswire.com/NewsRoom/AttachmentNg/1672c7bb-f970-403e-98e9-2a8a2ab13915
https://www.globenewswire.com/NewsRoom/AttachmentNg/187f26df-2228-414a-9f7d-8d304a83d1a4
https://www.globenewswire.com/NewsRoom/AttachmentNg/16aafdf0-30b3-464f-b6b8-a06c540a814b
https://www.globenewswire.com/NewsRoom/AttachmentNg/74838205-f253-44ad-9b5c-4034640f0cd8
https://www.globenewswire.com/NewsRoom/AttachmentNg/a5126a95-3125-48c0-b1a6-b7626e07d25f
https://www.globenewswire.com/NewsRoom/AttachmentNg/319af727-15ce-4903-bec5-190a35b989be

![]()
Figure 1
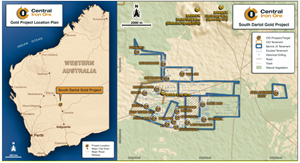
Locality map of the South Darlot project
Figure 2
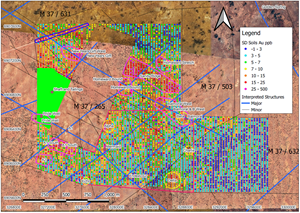
Au (ppb) dispersion in the South Darlot Gold Project with known mineralised deposits and areas of interest highlighted from both soil campaigns. Yellow circled areas were identified in P1 Soil campaign, whilst purple areas identified in P2 Soil campaign.
Figure 3
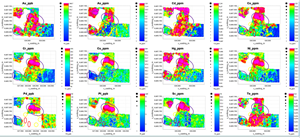
Screengrab of ioGAS™ observing Au and its correlation with base metal and other Au pathfinder elements. Red – Known mineral deposits, Yellow – Phase 1 Prospective areas for Au exploration, Purple – Phase 2 Prospective areas for Au exploration.
Figure 4
Li (ppm) dispersion in the South Darlot Gold Project .
Figure 5
Screengrab of ioGAS™ observing Li with respect to LCT Pegmatite pathfinders. Green – Prospective areas for Li/LCT Pegmatite exploration.
Figure 6
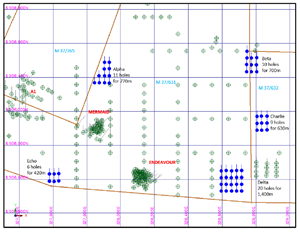
23 South Darlot AC Programme, highlighting previous drilling (green crosshairs) and locations of known mineralisation.
Figure 7
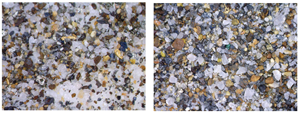
Left image – microscopy photo of panned Knelson concentrate. Right image – HG composite Panned Knelson concentrate. Seen in the images are the grains of visible gold, electrum, and copper bearing minerals, likely covellite, malachite and azurite. Copper minerals are in generally low abundance and not deleterious to recovery.
2023 GlobeNewswire, Inc., source
