Record free cash flow of
| |||||
All amounts are in
“We had an excellent third quarter financially and operationally with strong performances at all three operations driving costs significantly lower. This included another record quarter at Island Gold, and
“We remain focused on operating a sustainable business model that can support growing returns to shareholders over the long term. Given our strong free cash flow outlook, we are pleased to announce a 33% increase in our dividend, which has now grown by 300% since 2018. We expect to continue to generate strong free cash flow while reinvesting in high-return projects like La
Third Quarter 2020
- Generated record quarterly free cash flow1 of
$76.0 million driven by higher margins at all operations - Announced a 33% increase in the dividend to an annual rate of
US$0.08 per share, starting with the dividend payable inDecember 2020 . The increase is supported by the record free cash flow in the quarter and strong outlook. With the December dividend, the Company will have returned$31.0 million to shareholders in the form of dividends and share repurchases under the Company's Normal Course Issuer Bid ("NCIB") in 2020 - Produced 117,100 ounces of gold, a 49% increase from the second quarter of 2020 with production returning to budgeted levels following the temporary suspension of operations at Island Gold and Mulatos in the second quarter due to COVID-19
- Year-to-date the Company has produced 306,400 ounces of gold and remains well positioned to achieve revised full year guidance of 405,000 to 435,000 ounces of gold
- Island Gold produced a record 39,600 ounces of gold and generated record mine-site free cash flow1 of
$40.8 million , benefiting from higher grades mined in the quarter - Mulatos produced 41,100 ounces of gold and generated mine-site free cash flow1 of
$30.9 million , driven by lower total cash costs - Following the completion of the lower mine expansion at
Young -Davidson in July, underground mining rates increased to average 6,713 tonnes per day ("tpd") for the quarter and remain on track to achieve 7,500 tpd by the end of 2020 - Sold 116,035 ounces of gold at an average realized price of
$1,882 per ounce for revenues of$218.4 million - Generated record cash flow from operating activities of
$130.8 million ($130.0 million , or$0.33 per share, before changes in working capital1), a 62% increase from the third quarter of 2019 - Consolidated total cash costs1 of
$681 per ounce and all-in sustaining costs ("AISC")1 of$949 per ounce both decreased significantly from the first half of the year and were lower than revised guidance. The Company remains on track to achieve full year cost guidance - Reported record adjusted net earnings1 of
$56.9 million , or$0.15 per share1, which includes adjustments for unrealized foreign exchange gains of$10.7 million recorded within deferred taxes and foreign exchange, and other one time gains of$0.3 million . Adjusted net earnings increased 143% compared to the third quarter of 2019 - Realized record net earnings of
$67.9 million , or$0.17 per share - Ended the quarter with cash and cash equivalents of
$274.1 million and equity securities of$40.0 million . Subsequent to quarter-end, the Company repaid$100.0 million outstanding on its revolving credit facility and is currently debt-free - Reported results of the Phase III Expansion Study conducted on Island Gold, which is expected to drive a 72% increase in average annual production to 236,000 ounces and a 30% decrease in mine-site AISC to
$534 per ounce starting in 2025 - Announced a construction decision on the low-cost, high-return La
Yaqui Grande project. The project has a 58% after-tax internal rate of return ("IRR") at a$1,750 per ounce gold price and is expected to significantly reduceMulatos District costs with mine-site AISC expected to average$578 per ounce over the life of the project
(1) Refer to the “Non-GAAP Measures and Additional GAAP Measures” disclosure at the end of this press release and associated MD&A for a description and calculation of these measures.
Highlight Summary
| Three Months Ended | Nine Months Ended | |||||||||||
| 2020 | 2019 | 2020 | 2019 | |||||||||
| Financial Results (in millions) | ||||||||||||
| Operating revenues | ||||||||||||
| Cost of sales (1) | ||||||||||||
| Earnings from operations | ||||||||||||
| Earnings before income taxes | ||||||||||||
| Net earnings | ||||||||||||
| Adjusted net earnings (2) | ||||||||||||
| Earnings before interest, depreciation and amortization(2) | ||||||||||||
| Cash provided by operations before working capital and cash taxes(2) | ||||||||||||
| Cash provided by operating activities | ||||||||||||
| Capital expenditures (sustaining) (2) | ||||||||||||
| Capital expenditures (growth) (2) (3) | ||||||||||||
| Capital expenditures (capitalized exploration) (4) | ||||||||||||
| Operating Results | ||||||||||||
| Gold production (ounces) | 117,100 | 121,900 | 306,400 | 372,400 | ||||||||
| Gold sales (ounces) | 116,035 | 119,392 | 302,494 | 367,554 | ||||||||
| Per Ounce Data | ||||||||||||
| Average realized gold price | ||||||||||||
| Average spot gold price (London PM Fix) | ||||||||||||
| Cost of sales per ounce of gold sold (includes amortization) (1) | ||||||||||||
| Total cash costs per ounce of gold sold (2) | ||||||||||||
| All-in sustaining costs per ounce of gold sold (2) | ||||||||||||
| Share Data | ||||||||||||
| Earnings per share, basic and diluted | ||||||||||||
| Adjusted earnings per share, basic and diluted(2) | ||||||||||||
| Weighted average common shares outstanding (basic) (000’s) | 391,553 | 390,593 | 391,325 | 389,852 | ||||||||
| Financial Position (in millions) | ||||||||||||
| Cash and cash equivalents (5) | ||||||||||||
| Debt and financing obligations (5) | $— | |||||||||||
(1) Cost of sales includes mining and processing costs, royalties, and amortization expense. For the three months and nine months ended
(2) Refer to the “Non-GAAP Measures and Additional GAAP Measures” disclosure at the end of this press release and associated MD&A for a description and calculation of these measures.
(3) Includes growth capital from operating sites and excludes the Island Gold royalty repurchase of
(4) Includes capitalized exploration at Mulatos and Island Gold.
(5) Comparative cash and cash equivalents and debt and financing obligations balance as at
| Three Months Ended | Nine Months Ended | |||||||||||
| 2020 | 2019 | 2020 | 2019 | |||||||||
| Gold production (ounces) | ||||||||||||
| 36,400 | 50,000 | 88,200 | 140,000 | |||||||||
| Mulatos | 41,100 | 32,700 | 119,600 | 107,900 | ||||||||
| Island Gold | 39,600 | 36,700 | 97,800 | 111,800 | ||||||||
| — | 2,500 | 800 | 12,700 | |||||||||
| Gold sales (ounces) | ||||||||||||
| 35,548 | 48,430 | 86,893 | 137,091 | |||||||||
| Mulatos | 41,165 | 31,164 | 118,592 | 107,369 | ||||||||
| Island Gold | 39,322 | 37,209 | 97,009 | 110,094 | ||||||||
| — | 2,589 | — | 13,000 | |||||||||
| Cost of sales (in millions)(2) | ||||||||||||
| Mulatos | ||||||||||||
| Island Gold | ||||||||||||
| $— | $— | |||||||||||
| Cost of sales per ounce of gold sold (includes amortization) | ||||||||||||
| Mulatos | ||||||||||||
| Island Gold | ||||||||||||
| $— | $— | |||||||||||
| Total cash costs per ounce of gold sold (3) | ||||||||||||
| Mulatos | ||||||||||||
| Island Gold | ||||||||||||
| $— | $— | |||||||||||
| Mine-site all-in sustaining costs per ounce of gold sold (3),(4) | ||||||||||||
| Mulatos | ||||||||||||
| Island Gold | ||||||||||||
| $— | $— | |||||||||||
| Capital expenditures (sustaining, growth and capitalized exploration) (in millions)(3) | ||||||||||||
| Mulatos(5) | ||||||||||||
| Island Gold (6) | ||||||||||||
| Other | ||||||||||||
(1) El Chanate transitioned to the reclamation phase of the mine life in the fourth quarter of 2019. Incremental production is a result of rinsing the leach pad. Gold sales from
(2) Cost of sales includes mining and processing costs, royalties and amortization.
(3) Refer to the “Non-GAAP Measures and Additional GAAP Measures” disclosure at the end of this press release and associated MD&A for a description and calculation of these measures.
(4) For the purposes of calculating mine-site all-in sustaining costs, the Company does not include an allocation of corporate and administrative and share based compensation expenses.
(5) Includes capitalized exploration at Mulatos of $nil and
(6) Includes capitalized exploration at Island Gold of
Management's Response to the COVID-19 Pandemic
The
Specifically, each of our operating mine sites has activated established crisis management plans and developed site-specific plans that enable them to meet and respond to changing conditions associated with COVID-19. The Company is adopting the advice of public health authorities and adhering to government regulations with respect to COVID-19 in the jurisdictions in which it operates.
The following measures have been instituted across the Company to prevent the potential spread of the virus:
- Medical screening for all personnel prior to entry to site for symptoms of COVID-19
- Testing of personnel at Mulatos and Island Gold prior to starting their rotation at the camp
- Training on proper hand hygiene and social distancing
- Remote work options have been implemented for eligible employees
- Social distancing practices have been implemented for all meetings, huddles and transportation
- Mandatory use of personal protective equipment for employees where social distancing is not practicable
- Rigid camp and site hygiene protocols have been instituted and are being followed
- Elimination of all non-essential business travel
- Required 14-day quarantine for any employees returning from out of country travel
- In addition, since the COVID-19 pandemic began the Company’s teams in
Canada ,Mexico , andTurkey have donated their time, medical supplies, food supplies and funds to help combat the effects and spread of the virus
Impact on Operations
In order to protect nearby communities and align with government requirements, two of the Company's mines were temporarily suspended earlier in the year, but resumed normal operations during the second quarter. During the temporary suspensions, indirect production costs that exceeded normal operating capacity were expensed as incurred and not included in the inventory valuation. The Company identified indirect production costs of
In
In the third quarter of 2020, both Island Gold and Mulatos continued to incur additional costs related to testing of personnel, lodging and transportation, which have been included in mining and processing costs rather than COVID-19 costs. These incremental costs have increased total cash costs at these operations by approximately
Outlook and Strategy
| 2020 Updated Guidance | ||||||||||
| Island Gold | Mulatos | Other (2) | Total | Pre COVID-19 Guidance | ||||||
| Gold production (000’s ounces) | 135 - 145 | 130 - 140 | 140 - 150 | 405 - 435 | 425 - 465 | |||||
| Cost of sales, including amortization (in millions)(4) | — | $487 | $491 | |||||||
| Cost of sales, including amortization ($ per ounce)(4) | — | $1,160 | $1,103 | |||||||
| Total cash costs ($ per ounce)(1)(5) | — | |||||||||
| All-in sustaining costs ($ per ounce)(1)(5) | ||||||||||
| Mine-site all-in sustaining costs ($ per ounce)(1)(3)(5) | — | |||||||||
| Amortization costs ($ per ounce)(1) | — | $365 | $340 | |||||||
| Capital expenditures (in millions) | ||||||||||
| Sustaining capital(1) | $— | |||||||||
| Growth capital(1) | ||||||||||
| Capitalized exploration(1) | $— | $20 | $25 | |||||||
| Total capital expenditures and capitalized exploration(1) | ||||||||||
(1) Refer to the "Non-GAAP Measures and Additional GAAP" disclosure at the end of this press release and associated MD&A for a description of these measures.
(2) Includes growth capital and capitalized exploration at the Company's development projects (
(3) For the purposes of calculating mine-site all-in sustaining costs at individual mine sites, the Company does not include an allocation of corporate and administrative and share based compensation expenses to the mine sites.
(4) Cost of sales includes mining and processing costs, royalties, and amortization expense, and is calculated based on the mid-point of guidance.
(5) On
The Company’s long-term strategic objective is to generate increasing returns for its shareholders through low-cost production and free cash flow growth from its portfolio of operating mines and development projects. During the third quarter, the Company delivered on several catalysts that form key parts of a transformational year for Alamos and provide the foundation for the Company's strong outlook. These include the announcement of a Phase III expansion at Island Gold, a construction decision on the La
The Company expects this strong free cash flow to continue supporting higher dividends while also reinvesting in high return internal growth projects, such as those at Island Gold and Mulatos. These projects will in turn drive free cash flow higher and support growing, sustainable returns to shareholders over the long-term.
The record financial performance in the third quarter reflected higher gold prices and a very strong operational performance with production increasing 49% from the second quarter to 117,100 ounces at significantly lower total cash costs of
Following the temporary operational suspensions during the second quarter, all of the Company's mines are operating at normal capacity, albeit under strict health and safety protocols. These include regular testing for COVID-19 at a cost of approximately
Production increased significantly at
After temporarily suspending operations at Island Gold on
The Phase III expansion of Island Gold announced in July has outlined a bigger, more profitable, long-life operation. The expansion is expected to increase throughput rates 67% to 2,000 tpd, driving production significantly higher, at industry low costs over a mine life that has doubled to 16 years. This has driven a substantial increase in value with the expanded operation having an estimated after-tax NPV of
Exploration programs at Island Gold resumed in June following the temporary suspension, with the focus on continuing to expand mineralization and adding new near mine Mineral Resources. In the third quarter, Island Gold reported the best surface exploration hole to date, with high-grade mineralization intersected across significantly greater widths down-plunge from existing Mineral Resources in Island East (28.97 g/t Au (26.89 g/t cut) over 21.76 m (MH25-04)). The recent results continue to demonstrate the significant potential for additional growth in Mineral Reserves and Resources at the operation.
Mulatos began ramping up to full operations in the latter part of
As announced in July, 2020, the Company is proceeding with development of the high-return La
The Company submitted its Environmental Impact Statement ("EIS") for the
The Company's liquidity position remains strong, ending the quarter with
Third Quarter 2020 Results
Young-Davidson Financial and Operational Review
| Three Months Ended | Nine Months Ended | |||||||||||
| 2020 | 2019 | 2020 | 2019 | |||||||||
| Gold production (ounces) | 36,400 | 50,000 | 88,200 | 140,000 | ||||||||
| Gold sales (ounces) | 35,548 | 48,430 | 86,893 | 137,091 | ||||||||
| Financial Review (in millions) | ||||||||||||
| Operating Revenues | ||||||||||||
| Cost of sales (1) | ||||||||||||
| Earnings from operations | ||||||||||||
| Cash provided by operating activities | ||||||||||||
| Capital expenditures (sustaining) (2) | ||||||||||||
| Capital expenditures (growth) (2) | ||||||||||||
| Mine-site free cash flow (2) | ( | ) | ||||||||||
| Cost of sales, including amortization per ounce of gold sold (1) | ||||||||||||
| Total cash costs per ounce of gold sold (2) | ||||||||||||
| Mine-site all-in sustaining costs per ounce of gold sold (2),(3) | ||||||||||||
| Underground Operations | ||||||||||||
| Tonnes of ore mined | 617,551 | 607,766 | 1,252,300 | 1,808,613 | ||||||||
| Tonnes of ore mined per day | 6,713 | 6,606 | 4,570 | 6,625 | ||||||||
| Average grade of gold (4) | 2.24 | 2.62 | 2.27 | 2.53 | ||||||||
| Metres developed | 3,231 | 2,817 | 9,326 | 8,594 | ||||||||
| Mill Operations | ||||||||||||
| Tonnes of ore processed | 591,544 | 655,443 | 1,451,577 | 1,949,316 | ||||||||
| Tonnes of ore processed per day | 6,430 | 7,124 | 5,298 | 7,140 | ||||||||
| Average grade of gold (4) | 2.19 | 2.48 | 2.01 | 2.40 | ||||||||
| Contained ounces milled | 41,598 | 52,233 | 93,959 | 150,409 | ||||||||
| Average recovery rate | 93 | % | 92 | % | 92 | % | 91 | % | ||||
(1) Cost of sales includes mining and processing costs, royalties and amortization.
(2) Refer to the “Non-GAAP Measures and Additional GAAP Measures” disclosure at the end of this press release and associated MD&A for a description and calculation of these measures.
(3) For the purposes of calculating mine-site all-in sustaining costs, the Company does not include an allocation of corporate and administrative and share based compensation expenses.
(4) Grams per tonne of gold ("g/t Au").
Following completion of the lower mine expansion in July, underground mining rates increased through the quarter to average 6,713 tpd. In September, underground mining rates increased to average 8,000 tpd, with the operation benefiting from significant broken ore inventory built up during the shutdown. This strong performance demonstrates the expanded capacity of the lower-mine infrastructure. Underground mining rates are expected to increase to sustainable rates of 7,500 tpd by the end of 2020. The average mined grade was 2.24 g/t Au in the quarter, lower than full year guidance due to mine sequencing. Grades mined and processed are expected to increase in the fourth quarter.
Mill throughput was 6,430 tpd in the third quarter, a decrease from the same period of 2019 with low grade surface stockpiles having been depleted in the second quarter of 2020. Mining rates temporarily exceeded milling rates in the third quarter during which time excess underground ore was stockpiled. These stockpiles will be processed in the fourth quarter. Mill throughput is expected to equal underground mining rates moving forward. Mill recoveries averaged 93% in the quarter, slightly above the prior year period.
Financial Review
Third quarter revenues of
Cost of sales (which includes mining and processing costs, royalties, and amortization expense) of
Total cash costs of
With the transition to the new lower mine infrastructure and the associated reduction in underground mining costs and lower capital,
Island Gold Financial and Operational Review
| Three Months Ended | Nine Months Ended | |||||||||||
| 2020 | 2019 | 2020 | 2019 | |||||||||
| Gold production (ounces) | 39,600 | 36,700 | 97,800 | 111,800 | ||||||||
| Gold sales (ounces) | 39,322 | 37,209 | 97,009 | 110,094 | ||||||||
| Financial Review (in millions) | ||||||||||||
| Operating Revenues | ||||||||||||
| Cost of sales (1) | ||||||||||||
| Earnings from operations | ||||||||||||
| Cash provided by operating activities | ||||||||||||
| Capital expenditures (sustaining) (2) | ||||||||||||
| Capital expenditures (growth) (2) | ||||||||||||
| Capital expenditures (capitalized exploration) (2) | ||||||||||||
| Mine-site free cash flow (2) | ||||||||||||
| Cost of sales, including amortization per ounce of gold sold (1) | ||||||||||||
| Total cash costs per ounce of gold sold (2) | ||||||||||||
| Mine-site all-in sustaining costs per ounce of gold sold (2),(3) | ||||||||||||
| Underground Operations | ||||||||||||
| Tonnes of ore mined | 111,263 | 89,959 | 298,629 | 277,614 | ||||||||
| Tonnes of ore mined per day ("tpd") | 1,209 | 978 | 1,090 | 1,017 | ||||||||
| Average grade of gold (4) | 13.68 | 10.81 | 11.33 | 12.22 | ||||||||
| Metres developed | 1,430 | 1,211 | 4,313 | 4,200 | ||||||||
| Mill Operations | ||||||||||||
| Tonnes of ore processed | 101,447 | 102,564 | 281,082 | 307,364 | ||||||||
| Tonnes of ore processed per day | 1,103 | 1,115 | 1,026 | 1,126 | ||||||||
| Average grade of gold (4) | 13.62 | 11.12 | 11.52 | 11.49 | ||||||||
| Contained ounces milled | 44,414 | 36,675 | 104,072 | 113,560 | ||||||||
| Average recovery rate | 97 | % | 97 | % | 97 | % | 97 | % | ||||
(1) Cost of sales includes mining and processing costs, royalties, COVID-19 costs and maintenance costs and amortization.
(2) Refer to the “Non-GAAP Measures and Additional GAAP Measures” disclosure at the end of this press release and associated MD&A for a description and calculation of these measures.
(3) For the purposes of calculating mine-site all-in sustaining costs, the Company does not include an allocation of corporate and administrative and share based compensation expenses.
(4) Grams per tonne of gold ("g/t Au").
Island Gold produced a record 39,600 ounces in the third quarter, an 8% increase from the comparative period in 2019, reflecting higher grades mined and processed. The operation also generated record mine-site free cash flow of
Underground mining rates averaged 1,209 tpd in the quarter, a 24% increase from the prior year period and in line with annual guidance of 1,200 tpd. Underground grades mined averaged 13.68 g/t Au, above full year guidance due to mine sequencing with higher grade transverse stopes mined in the quarter. Mined grades are expected to return to full year guided levels in the fourth quarter.
Mill throughput of 1,103 tpd in the third quarter was consistent with the prior year period, but lower than tonnes mined due to unplanned down time. A bearing on the primary ball mill failed prematurely in mid-September, resulting in approximately 8 days of downtime. The bearing was replaced with the mill operating at budgeted levels before the end of September. Mill recoveries of 97% were in line with the prior year quarter and budget.
Phase III Expansion Study
On
- Average annual gold production of 236,000 ounces per year starting in 2025 upon completion of the shaft. This represents a 72% increase from the mid-point of initial 2020 production guidance
- Industry low average total cash costs of
$403 per ounce of gold and mine-site all-in sustaining costs of$534 per ounce starting in 2025, a 19% and 30% decrease from the mid-point of 2020 guidance, respectively - After-tax net present value (“NPV”) of
$1.02 billion at a 5% discount rate and an after-tax internal rate of return (“IRR”) of 17%, using a base case gold price assumption of$1,450 per ounce and a USD/CAD foreign exchange rate of$0 .75:1 - After-tax NPV of
$1.45 billion and an after-tax IRR of 22%, at a 5% discount rate using a gold price assumption of$1,750 per ounce and a USD/CAD foreign exchange rate of$0 .75:1 - Mine life of 16 years, double the current eight-year Mineral Reserve life. This is based on a mineable Mineral Resource of 9.6 million tonnes grading 10.45 grams per tonne of gold (“g/t Au”) containing 3.2 million ounces of gold
- Lowest combined capital and operating costs of all scenarios evaluated. Total life of mine capital of
$1.07 billion including sustaining capital. Higher life-of-mine growth capital of$514 million with the Shaft Expansion is more than offset by the lowest sustaining capital and operating costs of all scenarios evaluated.
For the remainder of 2020, the focus will be on progressing permitting and detailed engineering on the shaft and associated infrastructure. This includes the power supply upgrade and planning for the procurement of long lead time items. All of the Shaft Expansion permitting requirements are expected to be completed in 2022.
Financial Review
Island Gold generated revenues of
Cost of sales (includes mining and processing costs, royalties, COVID-19 costs and amortization expense) of
Total cash costs were
Total capital expenditures were
Earlier in 2020, the Company acquired and canceled a 3% NSR royalty payable on a majority of production from the Island Gold mine for cash consideration of
Island Gold generated record mine-site free cash flow of
Mulatos Financial and Operational Review
| Three Months Ended | Nine Months Ended | |||||||||||
| 2020 | 2019 | 2020 | 2019 | |||||||||
| Gold production (ounces) | 41,100 | 32,700 | 119,600 | 107,900 | ||||||||
| Gold sales (ounces) | 41,165 | 31,164 | 118,592 | 107,369 | ||||||||
| Financial Review (in millions) | ||||||||||||
| Operating Revenues | ||||||||||||
| Cost of sales (1) | ||||||||||||
| Earnings from operations | ||||||||||||
| Cash provided by operating activities | ||||||||||||
| Capital expenditures (sustaining) (2) | ||||||||||||
| Capital expenditures (growth) (2) | ||||||||||||
| Capital expenditures (capitalized exploration) (2) | $— | $— | $— | |||||||||
| Mine-site free cash flow (2) | ( | ) | ( | ) | ||||||||
| Cost of sales, including amortization per ounce of gold sold (1) | ||||||||||||
| Total cash costs per ounce of gold sold (2) | ||||||||||||
| Mine site all-in sustaining costs per ounce of gold sold (2),(3) | ||||||||||||
| Open Pit Operations | ||||||||||||
| Tonnes of ore mined - open pit (4) | 1,320,034 | 1,664,898 | 4,370,921 | 5,608,221 | ||||||||
| Total waste mined - open pit (6) | 2,130,232 | 1,361,660 | 5,621,000 | 5,036,918 | ||||||||
| Total tonnes mined - open pit | 3,450,266 | 3,026,558 | 9,991,921 | 10,645,139 | ||||||||
| Waste-to-ore ratio (operating) | 0.76 | 0.63 | 0.70 | 0.66 | ||||||||
| Crushing and Heap Leach Operations | ||||||||||||
| Tonnes of ore stacked | 1,894,725 | 1,628,401 | 5,338,725 | 5,466,393 | ||||||||
| Average grade of gold processed (5) | 0.91 | 0.81 | 1.17 | 0.92 | ||||||||
| Contained ounces stacked | 55,411 | 42,667 | 201,455 | 161,450 | ||||||||
| Average recovery rate | 74 | % | 77 | % | 59 | % | 67 | % | ||||
| Ore crushed per day (tonnes) - combined | 20,600 | 17,700 | 19,484 | 20,000 | ||||||||
(1) Cost of sales includes mining and processing costs, royalties, COVID-19 costs and amortization.
(2) Refer to the “Non-GAAP Measures and Additional GAAP Measures” disclosure at the end of this press release and associated MD&A for a description and calculation of these measures.
(3) For the purposes of calculating mine-site all-in sustaining costs, the Company does not include an allocation of corporate and administrative and share based compensation expenses.
(4) Includes ore stockpiled during the quarter.
(5) Grams per tonne of gold ("g/t Au").
(6) Total waste mined includes operating waste and capitalized stripping.
Mulatos produced 41,100 ounces in the third quarter, 26% higher than the prior year quarter. The increase is primarily due to the contribution of higher grade ore from
Total tonnes mined increased slightly compared to the third quarter of 2019, reflecting increased stripping activities at
Total crusher throughput in the third quarter averaged 20,600 tpd for a total of 1,894,725 tonnes stacked at a grade of 0.91 g/t Au. Tonnes stacked in the quarter exceeded tonnes mined due to the processing of SAS stockpiles, and the minimal impact of the rainy season on crusher performance in 2020. Grades stacked were 12% higher than the comparative period of 2019, reflecting the contribution of higher-grade ore from
Financial Review
Third quarter revenues of
Cost of sales (includes mining and processing costs, royalties, COVID-19 costs and amortization expense) of
Total cash costs in the quarter and year-to-date were lower compared to the prior year as a result of higher grades stacked, driven by
Mulatos generated mine-site free cash-flow of
Third Quarter 2020 Development Activities
Mulatos District (
La
On
La Yaqui Grande Project Highlights:
- Average annual gold production of 123,000 ounces per year starting in the third quarter of 2022. This will replace higher cost production from the main Mulatos pit, keeping combined production at approximately 150,000 ounces per year
- Mine-site all-in sustaining costs of
$578 per ounce, significantly reducingMulatos District all-in sustaining costs from the mid-point of previous 2020 guidance of$960 per ounce - After-tax net present value (“NPV”) of
$165 million at a 5% discount rate and an after-tax internal rate of return (“IRR”) of 41%, using a base case gold price assumption of$1,450 per ounce and a MXN/USD foreign exchange rate of 21:1 - After-tax NPV of
$260 million and an after-tax IRR of 58% at a 5% discount rate using a gold price assumption of$1,750 per ounce and a MXN/USD foreign exchange rate of 21:1 - Mine life of five years, extending production from the
Mulatos District to 2027, based on current Mineral Reserves - Initial capital of
$137 million to be spent over a two year period starting in the second half of 2020. At a$1,750 per ounce gold price, Mulatos is expected to self finance the development of LaYaqui Grande following which the operation is expected to generate strong free cash flow
During the third quarter, the Company incurred
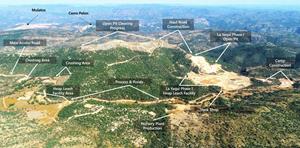
La Yaqui Grande Site Overview
A photo accompanying this announcement is available at https://www.globenewswire.com/NewsRoom/AttachmentNg/39979c13-e430-473c-9721-f110767cd716
Kirazlı (Çanakkale,
On
The Company has met all the regulatory requirements and conditions for the concessions to be renewed and reasonably expected the renewal by the expiration date. The communities local to the Kirazlı project remain supportive. As such, the Company is working with the
The Company spent
The Company released a positive Feasibility Study on the
The project economics based on the 2017 Feasibility Study at
Development spending (excluding exploration) was
Third Quarter 2020 Exploration Activities
Island Gold (
The 2020 exploration drilling program is focused on continuing to expand the down-plunge and lateral extensions of the Island Gold deposit with the objective of adding new near mine Mineral Resources across the two-kilometre long
Underground diamond drilling program continued through the third quarter with four drill rigs currently operating, including two focused on underground directional drilling. The surface directional diamond drilling program resumed in early June, after being suspended in
An initial 4,000 m regional exploration program is also planned in the fourth quarter of 2020 focused on evaluating and advancing exploration targets outside the main
Surface exploration drilling
A total of 5,539 m was completed in six holes during the third quarter as part of the surface directional drilling program. Directional drilling targeted areas peripheral to the Inferred Mineral Resource blocks below the 1,000 m level, with drill hole spacing ranging from 75 m to 100 m. The area that was targeted by the surface directional drill program extends approximately 2,000 m in strike length between the 1,000 m and 1,500 m elevation below surface.
Previously reported highlights in the third quarter from the surface drilling program in Island
- 28.97 g/t Au (26.89 g/t cut) over 21.76 m (true width) (MH25-04); and
- 15.38 g/t Au (14.19 g/t cut) over 15.02 m (true width) (MH25-03).
Drill holes MH25-03 and MH25-04 intersected wide, high-grade gold mineralization 40 m and 100 m, respectively down-plunge from the high-grade Inferred Mineral Resource block which contained 719,800 ounces, grading 18.74 g/t Au (1.2 million tonnes) as of
Underground exploration drilling
During the third quarter of 2020, a total of 8,262 m of underground exploration drilling was completed in 21 holes from the 620, 740 and 840 levels. The objective of the underground drilling is to identify new Mineral Resources close to existing Mineral Resource or Reserve blocks. A total of 34 m of underground exploration drift development was completed on the 340, 740, and 840 levels during the third quarter of 2020.
Total exploration expenditures during the third quarter were
Mulatos District (
The Company has a large exploration package covering 28,972 hectares with the majority of past exploration efforts focused around the Mulatos mine. Over the last three years, exploration has moved beyond the main Mulatos pit area and is focused on earlier stage prospects throughout the wider district.
Exploration activities were suspended at the beginning of the second quarter of 2020 in response to COVID-19. As a result, limited exploration activities were undertaken in the third quarter. Exploration activities restarted early in the fourth quarter of 2020, primarily at
Exploration activities at the
Review of Third Quarter Financial Results
During the third quarter of 2020, the Company sold 116,035 ounces of gold for revenue of
The average realized gold price in the third quarter was
Cost of sales were
Mining and processing costs were
Consolidated total cash costs for the quarter were
AISC were
Royalty expense was
Amortization of
The Company recognized earnings from operations of
The Company reported net earnings of
Associated Documents
This press release should be read in conjunction with the Company’s interim consolidated financial statements for the three-month period ended
Reminder of Third Quarter 2020 Results Conference Call
The Company's senior management will host a conference call on
Participants may join the conference call by dialling (416) 340-2216 or (800) 273-9672 for calls within
A playback will be available until
Qualified Persons
About Alamos
Alamos is a Canadian-based intermediate gold producer with diversified production from three operating mines in
FOR FURTHER INFORMATION, PLEASE CONTACT:
Vice-President, Investor Relations
(416) 368-9932 x 5439
The TSX and NYSE have not reviewed and do not accept responsibility for the adequacy or accuracy of this release.
Cautionary Note Regarding Forward-Looking Statements
This press release contains or incorporates by reference “forward-looking statements” and “forward-looking information” as defined under applicable Canadian and
Such statements include information as to strategy, plans or future financial or operating performance, such as the Company’s expansion plans, project timelines, production plans and expected sustainable productivity increases, expected increases in mining activities and corresponding cost efficiencies, expected drilling targets, expected sustaining costs, expected improvements in cash flows and margins, expectations of changes in capital expenditures, forecasted cash shortfalls and the Company’s ability to fund them, cost estimates, projected exploration results, reserve and resource estimates, expected production rates and use of the stockpile inventory, expected recoveries, sufficiency of working capital for future commitments and other statements that express management’s expectations or estimates of future performance.
Alamos cautions that forward-looking statements are necessarily based upon a number of factors and assumptions that, while considered reasonable by the Company at the time of making such statements, are inherently subject to significant business, economic, legal, political and competitive uncertainties and contingencies. Known and unknown factors could cause actual results to differ materially from those projected in the forward-looking statements.
Such factors and assumptions underlying the forward-looking statements in this document include, but are not limited to: changes to current estimates of mineral reserves and resources; changes to production estimates (which assume accuracy of projected ore grade, mining rates, recovery timing and recovery rate estimates and may be impacted by unscheduled maintenance; labour and contractor availability and other operating or technical difficulties); operations may be exposed to new diseases, epidemics and pandemics, including the effects and potential effects of the global COVID-19 widespread pandemic; the impact of the COVID-19 pandemic on the broader market and the trading price of the Company's shares; provincial and federal orders or mandates (including with respect to mining operations generally or auxiliary businesses or services required for our operations) in
Additional risk factors and details with respect to risk factors affecting the Company’s ability to achieve the expectations set forth in the forward-looking statements contained in this press release are set out in the Company's 40-F/Annual Information Form for the year ended
The Company disclaims any intention or obligation to update or revise any forward-looking statements whether as a result of new information, future events or otherwise, except as required by applicable law.
Cautionary Note to U.S. Investors Concerning Measured, Indicated and Inferred Resources
Unless otherwise indicated, all Mineral Resource and Mineral Reserve estimates included in this press release have been prepared in accordance with National Instrument 43-101 - Standards of Disclosure for Mineral Projects (“NI 43-101”) and the
NI 43-101 is a rule developed by the Canadian Securities Administrators, which established standards for all public disclosure an issuer makes of scientific and technical information concerning mineral projects. The terms “Mineral Reserve”, “Proven Mineral Reserve” and “Probable Mineral Reserve” are Canadian mining terms as defined in accordance with NI 43-101 and the CIM Standards. These definitions differ materially from the definitions in SEC Industry Guide 7 (“SEC Industry Guide 7”) under
Investors are cautioned not to assume that all or any part of an Inferred Mineral Resource exists or is economically or legally mineable. Disclosure of “contained ounces” in a Mineral Resource is permitted disclosure under Canadian regulations; however, the
International Financial Reporting Standards: The condensed consolidated financial statements of the Company have been prepared by management in accordance with International Accounting Standard 34, Interim Financial Reporting, as issued by the
Non-GAAP Measures and Additional GAAP Measures
The Company has included certain non-GAAP financial measures to supplement its Consolidated Financial Statements, which are presented in accordance with IFRS, including the following:
- adjusted net earnings and adjusted earnings per share;
- cash flow from operating activities before changes in working capital and taxes received;
- Company-wide free cash flow;
- total mine-site free cash flow;
- mine-site free cash flow;
- net cash;
- total cash cost per ounce of gold sold;
- all-in sustaining cost ("AISC") per ounce of gold sold;
- mine-site all-in sustaining cost ("Mine-site AISC") per ounce of gold sold;
- sustaining and non-sustaining capital expenditures; and
- earnings before interest, taxes, depreciation, and amortization
The Company believes that these measures, together with measures determined in accordance with IFRS, provide investors with an improved ability to evaluate the underlying performance of the Company. Non-GAAP financial measures do not have any standardized meaning prescribed under IFRS, and therefore they may not be comparable to similar measures employed by other companies. The data is intended to provide additional information and should not be considered in isolation or as a substitute for measures of performance prepared in accordance with IFRS. Management's determination of the components of non-GAAP and additional measures are evaluated on a periodic basis influenced by new items and transactions, a review of investor uses and new regulations as applicable. Any changes to the measures are dully noted and retrospectively applied as applicable.
Adjusted Net Earnings and Adjusted Earnings per Share
“Adjusted net earnings” and “adjusted earnings per share” are non-GAAP financial measures with no standard meaning under IFRS which exclude the following from net earnings:
- Foreign exchange gain (loss)
- Items included in other gain (loss)
- Certain non-reoccurring items
- Foreign exchange gain (loss) recorded in deferred tax expense
Net earnings have been adjusted, including the associated tax impact, for the group of costs in “Other loss” on the consolidated statement of comprehensive income. Transactions within this grouping are: the fair value changes on non-hedged derivatives; the renunciation of flow-through exploration expenditures; and loss on disposal of assets. The adjusted entries are also impacted for tax to the extent that the underlying entries are impacted for tax in the unadjusted net earnings.
The Company uses adjusted net earnings for its own internal purposes. Management’s internal budgets and forecasts and public guidance do not reflect the items which have been excluded from the determination of adjusted net earnings. Consequently, the presentation of adjusted net earnings enables shareholders to better understand the underlying operating performance of the core mining business through the eyes of management. Management periodically evaluates the components of adjusted net earnings based on an internal assessment of performance measures that are useful for evaluating the operating performance of our business and a review of the non-GAAP measures used by mining industry analysts and other mining companies.
Adjusted net earnings is intended to provide additional information only and does not have any standardized meaning under IFRS and may not be comparable to similar measures presented by other companies. It should not be considered in isolation or as a substitute for measures of performance prepared in accordance with IFRS. The measure is not necessarily indicative of operating profit or cash flows from operations as determined under IFRS. The following table reconciles this non-GAAP measure to the most directly comparable IFRS measure.
| (in millions) | ||||||||||||
| Three Months Ended | Nine Months Ended | |||||||||||
| 2020 | 2019 | 2020 | 2019 | |||||||||
| Net earnings | ||||||||||||
| Adjustments: | ||||||||||||
| COVID-19 costs | — | — | 6.5 | — | ||||||||
| Foreign exchange (gain) loss | (0.8 | ) | — | 4.1 | (0.3 | ) | ||||||
| Other loss (gain) | 1.9 | (0.8 | ) | 6.8 | (2.5 | ) | ||||||
| Unrealized foreign exchange (gain) loss recorded in deferred tax expense | (9.9 | ) | 6.5 | 16.8 | (4.6 | ) | ||||||
| Other income tax and mining tax adjustments | (2.2 | ) | — | (5.3 | ) | 0.7 | ||||||
| Adjusted net earnings | ||||||||||||
| Adjusted earnings per share - basic and diluted | ||||||||||||
Cash Flow from Operating Activities before Changes in Working Capital and Cash Taxes
“Cash flow from operating activities before changes in working capital and cash taxes” is a non-GAAP performance measure that could provide an indication of the Company’s ability to generate cash flows from operations, and is calculated by adding back the change in working capital and taxes received to “Cash provided by (used in) operating activities” as presented on the Company’s consolidated statements of cash flows. “Cash flow from operating activities before changes in working capital” is a non-GAAP financial measure with no standard meaning under IFRS.
The following table reconciles the non-GAAP measure to the consolidated statements of cash flows.
| (in millions) | ||||||||||||
| Three Months Ended | Nine Months Ended | |||||||||||
| 2020 | 2019 | 2020 | 2019 | |||||||||
| Cash flow from operating activities | ||||||||||||
| Add (less): Changes in working capital and cash taxes | (0.8 | ) | 12.3 | 19.4 | 28.8 | |||||||
| Cash flow from operating activities before changes in working capital and cash taxes | $130.0 | $80.2 | $256.4 | $211.4 | ||||||||
Company-wide Free Cash Flow
“Company-wide free cash flow" is a non-GAAP performance measure calculated from the consolidated operating cash flow, less consolidated mineral property, plant and equipment expenditures. The Company believes this to be a useful indicator of our ability to operate without reliance on additional borrowing or usage of existing cash company-wide. Company-wide free cash flow is intended to provide additional information only and does not have any standardized meaning under IFRS and may not be comparable to similar measures of performance presented by other mining companies. Company-wide free cash flow should not be considered in isolation or as a substitute for measures of performance prepared in accordance with IFRS.
| (in millions) | ||||||||||||
| Three Months Ended | Nine Months Ended | |||||||||||
| 2020 | 2019 | 2020 | 2019 | |||||||||
| Cash flow from operating activities | ||||||||||||
| Less: mineral property, plant and equipment expenditures | (54.8 | ) | (66.3 | ) | (172.7 | ) | (190.7 | ) | ||||
| Company-wide free cash flow | $76.0 | $1.6 | $64.3 | ($8.1 | ) | |||||||
Mine-site Free Cash Flow
"Mine-site free cash flow" is a non-GAAP financial performance measure calculated as cash flow from mine-site operating activities, less mineral property, plant and equipment expenditures. The Company believes this to be a useful indicator of our ability to operate without reliance on additional borrowing or usage of existing cash. Mine-site free cash flow is intended to provide additional information only and does not have any standardized meaning under IFRS and may not be comparable to similar measures of performance presented by other mining companies. Mine-site free cash flow should not be considered in isolation or as a substitute for measures of performance prepared in accordance with IFRS.
| Total Mine-Site Free Cash Flow | ||||||||||||
| Three Months Ended | Nine Months Ended | |||||||||||
| 2020 | 2019 | 2020 | 2019 | |||||||||
| (in millions) | ||||||||||||
| Cash flow from operating activities | ||||||||||||
| Add: operating cash flow used by non-mine site activity | 2.3 | 6.2 | 23.4 | 22.7 | ||||||||
| Cash flow from operating mine-sites | $133.1 | $74.1 | $260.4 | $205.3 | ||||||||
| Mineral property, plant and equipment expenditure 1 | ||||||||||||
| Less: capital expenditures from development projects, and corporate | (4.2 | ) | (15.7 | ) | (15.0 | ) | (28.9 | ) | ||||
| Capital expenditure from mine-sites | $50.6 | $50.6 | $157.7 | $161.8 | ||||||||
| Total mine-site free cash flow | $82.5 | $23.5 | $102.7 | $43.5 | ||||||||
(1) Excludes royalty repurchase of
| Young-Davidson Mine-Site Free Cash Flow | ||||||||||||
| Three Months Ended | Nine Months Ended | |||||||||||
| 2020 | 2019 | 2020 | 2019 | |||||||||
| (in millions) | ||||||||||||
| Cash flow from operating activities | ||||||||||||
| Mineral property, plant and equipment expenditure | (25.6 | ) | (23.9 | ) | (82.2 | ) | (72.9 | ) | ||||
| Mine-site free cash flow | $10.8 | $3.4 | ($31.2 | ) | $0.9 | |||||||
| Mulatos Mine-Site Free Cash Flow | ||||||||||||
| Three Months Ended | Nine Months Ended | |||||||||||
| 2020 | 2019 | 2020 | 2019 | |||||||||
| (in millions) | ||||||||||||
| Cash flow from operating activities | ||||||||||||
| Mineral property, plant and equipment expenditure | (9.1 | ) | (12.9 | ) | (21.6 | ) | (44.7 | ) | ||||
| Mine-site free cash flow | $30.9 | ($5.7 | ) | $64.3 | ($13.7 | ) | ||||||
| Island Gold Mine-Site Free Cash Flow | ||||||||||||
| Three Months Ended | Nine Months Ended | |||||||||||
| 2020 | 2019 | 2020 | 2019 | |||||||||
| (in millions) | ||||||||||||
| Cash flow from operating activities | ||||||||||||
| Mineral property, plant and equipment expenditure 1 | (15.9 | ) | (13.8 | ) | (53.9 | ) | (44.2 | ) | ||||
| Mine-site free cash flow | $40.8 | $26.8 | $69.6 | $55.1 | ||||||||
(1) Excludes royalty repurchase of
The Company defines net cash as cash and cash equivalents less long-term debt, as this metric reflects the financial position at the end of the period and the ability to fund its future development.
Total Cash Costs per ounce
Total cash costs per ounce is a non-GAAP term typically used by gold mining companies to assess the level of gross margin available to the Company by subtracting these costs from the unit price realized during the period. This non-GAAP term is also used to assess the ability of a mining company to generate cash flow from operations. Total cash costs per ounce includes mining and processing costs plus applicable royalties, and net of by-product revenue and net realizable value adjustments. This metric excludes COVID-19 costs incurred in the period. Total cash costs per ounce is exclusive of exploration costs.
Total cash costs per ounce is intended to provide additional information only and does not have any standardized meaning under IFRS and may not be comparable to similar measures presented by other mining companies. It should not be considered in isolation or as a substitute for measures of performance prepared in accordance with IFRS. The measure is not necessarily indicative of cash flow from operations under IFRS or operating costs presented under IFRS.
All-in Sustaining Costs per ounce and Mine-site All-in Sustaining Costs
The Company adopted an “all-in sustaining costs per ounce” non-GAAP performance measure in accordance with the
For the purposes of calculating "mine-site all-in sustaining costs" at the individual mine-sites, the Company does not include an allocation of corporate and administrative costs and share-based compensation, as detailed in the reconciliations below.
Sustaining capital expenditures are expenditures that do not increase annual gold ounce production at a mine site and excludes all expenditures at the Company’s development projects as well as certain expenditures at the Company’s operating sites that are deemed expansionary in nature. For each mine-site reconciliation, corporate and administrative costs, and non-site specific costs are not included in the all-in sustaining cost per ounce calculation.
All-in sustaining costs per gold ounce is intended to provide additional information only and does not have any standardized meaning under IFRS and may not be comparable to similar measures presented by other mining companies. It should not be considered in isolation or as a substitute for measures of performance prepared in accordance with IFRS.
The measure is not necessarily indicative of cash flow from operations under IFRS or operating costs presented under IFRS.
Total Cash Costs and All-in Sustaining Costs per Ounce Reconciliation Tables
The following tables reconciles these non-GAAP measures to the most directly comparable IFRS measures on a Company-wide and individual mine-site basis.
| Total Cash Costs and AISC Reconciliation - Company-wide | ||||||||||||
| Three Months Ended | Nine Months Ended | |||||||||||
| 2020 | 2019 | 2020 | 2019 | |||||||||
| (in millions, except ounces and per ounce figures) | ||||||||||||
| Mining and processing | ||||||||||||
| Royalties | 2.8 | 4.2 | 6.9 | 13.0 | ||||||||
| Total cash costs | ||||||||||||
| Gold ounces sold | 116,035 | 119,392 | 302,494 | 367,554 | ||||||||
| Total cash costs per ounce | $681 | $730 | $772 | $720 | ||||||||
| Total cash costs | ||||||||||||
| Corporate and administrative(1) | 5.0 | 4.5 | 15.3 | 14.6 | ||||||||
| Sustaining capital expenditures(2) | 22.7 | 17.8 | 54.6 | 53.5 | ||||||||
| Share-based compensation | 1.3 | 1.7 | 9.1 | 7.7 | ||||||||
| Sustaining exploration | 1.3 | 1.4 | 3.8 | 4.2 | ||||||||
| Accretion of decommissioning liabilities | 0.8 | 0.8 | 2.0 | 2.2 | ||||||||
| Total all-in sustaining costs | ||||||||||||
| Gold ounces sold | 116,035 | 119,392 | 302,494 | 367,554 | ||||||||
| All-in sustaining costs per ounce | $949 | $950 | $1,052 | $944 | ||||||||
(1) Corporate and administrative expenses exclude expenses incurred at development properties.
(2) Sustaining capital expenditures are defined as those expenditures which do not increase annual gold ounce production at a mine site and exclude all expenditures at growth projects and certain expenditures at operating sites which are deemed expansionary in nature. Total sustaining capital for the period is as follows:
| Three Months Ended | Nine Months Ended | |||||||||||
| 2020 | 2019 | 2020 | 2019 | |||||||||
| (in millions) | ||||||||||||
| Capital expenditures per cash flow statement | ||||||||||||
| Less: non-sustaining capital expenditures at: | ||||||||||||
| (16.0 | ) | (15.3 | ) | (62.9 | ) | (43.1 | ) | |||||
| Mulatos | (3.0 | ) | (10.8 | ) | (7.0 | ) | (39.4 | ) | ||||
| Island Gold | (8.9 | ) | (6.7 | ) | (33.2 | ) | (25.8 | ) | ||||
| Corporate and other | (4.2 | ) | (15.7 | ) | (15.0 | ) | (28.9 | ) | ||||
| Sustaining capital expenditures | ||||||||||||
| Young-Davidson Total Cash Costs and Mine-site AISC Reconciliation | ||||||||||||
| Three Months Ended | Nine Months Ended | |||||||||||
| 2020 | 2019 | 2020 | 2019 | |||||||||
| (in millions, except ounces and per ounce figures) | ||||||||||||
| Mining and processing | ||||||||||||
| Royalties | 1.0 | 1.2 | 2.5 | 2.9 | ||||||||
| Total cash costs | ||||||||||||
| Gold ounces sold | 35,548 | 48,430 | 86,893 | 137,091 | ||||||||
| Total cash costs per ounce | $923 | $781 | $1,145 | $813 | ||||||||
| Total cash costs | ||||||||||||
| Sustaining capital expenditures | 9.6 | 8.6 | 19.3 | 29.8 | ||||||||
| Sustaining exploration | — | 0.1 | — | 0.3 | ||||||||
| Accretion of decommissioning liabilities | 0.1 | — | 0.2 | 0.1 | ||||||||
| Total all-in sustaining costs | ||||||||||||
| Gold ounces sold | 35,548 | 48,430 | 86,893 | 137,091 | ||||||||
| Mine-site all-in sustaining costs per ounce | $1,196 | $960 | $1,370 | $1,033 | ||||||||
| Mulatos Total Cash Costs and Mine-site AISC Reconciliation | ||||||||||||
| Three Months Ended | Nine Months Ended | |||||||||||
| 2020 | 2019 | 2020 | 2019 | |||||||||
| (in millions, except ounces and per ounce figures) | ||||||||||||
| Mining and processing | ||||||||||||
| Royalties | 0.4 | 0.3 | 1.0 | 2.9 | ||||||||
| Total cash costs | ||||||||||||
| Gold ounces sold | 41,165 | 31,164 | 118,592 | 107,369 | ||||||||
| Total cash costs per ounce | $746 | $866 | $772 | $772 | ||||||||
| Total cash costs | ||||||||||||
| Sustaining capital expenditures | 6.1 | 2.1 | 14.6 | 5.3 | ||||||||
| Sustaining exploration | 0.8 | 0.8 | 2.3 | 2.4 | ||||||||
| Accretion of decommissioning liabilities | 0.6 | 0.6 | 1.7 | 1.8 | ||||||||
| Total all-in sustaining costs | ||||||||||||
| Gold ounces sold | 41,165 | 31,164 | 118,592 | 107,369 | ||||||||
| Mine-site all-in sustaining costs per ounce | $928 | $979 | $928 | $861 | ||||||||
| Island Gold Total Cash Costs and Mine-site AISC Reconciliation | ||||||||||||
| Three Months Ended | Nine Months Ended | |||||||||||
| 2020 | 2019 | 2020 | 2019 | |||||||||
| (in millions, except ounces and per ounce figures) | ||||||||||||
| Mining and processing | ||||||||||||
| Royalties | 1.4 | 2.7 | 3.4 | 7.2 | ||||||||
| Total cash costs | ||||||||||||
| Gold ounces sold | 39,322 | 37,209 | 97,009 | 110,094 | ||||||||
| Total cash costs per ounce | $394 | $503 | $438 | $490 | ||||||||
| Total cash costs | ||||||||||||
| Sustaining capital expenditures | 7.0 | 7.1 | 20.7 | 18.4 | ||||||||
| Total all-in sustaining costs | ||||||||||||
| Gold ounces sold | 39,322 | 37,209 | 97,009 | 110,094 | ||||||||
| Mine-site all-in sustaining costs per ounce | $575 | $693 | $653 | $658 | ||||||||
Earnings Before Interest, Taxes, Depreciation, and Amortization (“EBITDA”)
EBITDA represents net earnings before interest, taxes, depreciation, and amortization. EBITDA is an indicator of the Company’s ability to generate liquidity by producing operating cash flow to fund working capital needs, service debt obligations, and fund capital expenditures.
EBITDA does not have any standardized meaning under IFRS and may not be comparable to similar measures presented by other mining companies. It should not be considered in isolation or as a substitute for measures of performance prepared in accordance with IFRS.
The following is a reconciliation of EBITDA to the consolidated financial statements:
| (in millions) | ||||||||||||
| Three Months Ended | Nine Months Ended | |||||||||||
| 2020 | 2019 | 2020 | 2019 | |||||||||
| Net earnings | ||||||||||||
| Add back: | ||||||||||||
| COVID-19 costs | — | — | 6.5 | — | ||||||||
| Finance expense | 1.0 | 0.9 | 3.0 | 2.1 | ||||||||
| Amortization | 43.6 | 40.1 | 106.2 | 120.8 | ||||||||
| Deferred income tax (recovery) expense | 6.4 | 15.9 | 44.7 | 8.5 | ||||||||
| Current income tax expense | 11.6 | 3.8 | 20.4 | 18.5 | ||||||||
| EBITDA | $130.5 | $78.4 | $248.1 | $208.0 | ||||||||
Additional GAAP Measures
Additional GAAP measures are presented on the face of the Company’s consolidated statements of comprehensive income (loss) and are not meant to be a substitute for other subtotals or totals presented in accordance with IFRS, but rather should be evaluated in conjunction with such IFRS measures. The following additional GAAP measures are used and are intended to provide an indication of the Company’s mine and operating performance:
- Earnings from operations - represents the amount of earnings before net finance income/expense, foreign exchange gain/loss, other income/loss, loss on redemption of senior secured notes and income tax expense
| Unaudited Consolidated Statements of Financial Position, Comprehensive Income, and Cash Flow | |||||||
Consolidated Statements of Financial Position (Unaudited - stated in millions of | |||||||
| A S S E T S | |||||||
| Current Assets | |||||||
| Cash and cash equivalents | |||||||
| Equity securities | 40.0 | 22.8 | |||||
| Amounts receivable | 41.6 | 37.4 | |||||
| Income taxes receivable | — | 4.6 | |||||
| Inventory | 136.1 | 126.9 | |||||
| Other current assets | 19.3 | 19.8 | |||||
| Total Current Assets | 511.1 | 394.3 | |||||
| Non-Current Assets | |||||||
| Long-term inventory | 22.9 | 25.7 | |||||
| Mineral property, plant and equipment | 3,040.2 | 2,933.4 | |||||
| Other non-current assets | 42.5 | 43.1 | |||||
| Total Assets | $3,616.7 | $3,396.5 | |||||
| L I A B I L I T I E S | |||||||
| Current Liabilities | |||||||
| Accounts payable and accrued liabilities | |||||||
| Debt and financing obligations | 100.0 | — | |||||
| Income taxes payable | 11.4 | — | |||||
| Total Current Liabilities | 227.6 | 127.3 | |||||
| Non-Current Liabilities | |||||||
| Deferred income taxes | 559.4 | 513.7 | |||||
| Decommissioning liabilities | 57.0 | 57.1 | |||||
| Other non-current liabilities | 3.1 | 3.1 | |||||
| Total Liabilities | 847.1 | 701.2 | |||||
| E Q U I T Y | |||||||
| Share capital | |||||||
| Contributed surplus | 90.3 | 90.7 | |||||
| Accumulated other comprehensive loss | 10.2 | (0.2 | ) | ||||
| Deficit | (1,033.1 | ) | (1,088.5 | ) | |||
| Total Equity | 2,769.6 | 2,695.3 | |||||
| Total Liabilities and Equity | $3,616.7 | $3,396.5 | |||||
Consolidated Statements of Comprehensive Income (Unaudited - stated in millions of | |||||||||||||||
| For three months ended | For nine months ended | ||||||||||||||
| 2020 | 2019 | 2020 | 2019 | ||||||||||||
| OPERATING REVENUES | |||||||||||||||
| COST OF SALES | |||||||||||||||
| Mining and processing | 76.2 | 83.0 | 226.6 | 251.6 | |||||||||||
| Royalties | 2.8 | 4.2 | 6.9 | 13.0 | |||||||||||
| COVID-19 costs | — | — | 6.5 | — | |||||||||||
| Amortization | 43.6 | 40.1 | 106.2 | 120.8 | |||||||||||
| 122.6 | 127.3 | 346.2 | 385.4 | ||||||||||||
| EXPENSES | |||||||||||||||
| Exploration | 1.5 | 1.9 | 4.6 | 5.0 | |||||||||||
| Corporate and administrative | 5.0 | 4.5 | 15.3 | 14.6 | |||||||||||
| Share-based compensation | 1.3 | 1.7 | 9.1 | 7.7 | |||||||||||
| 130.4 | 135.4 | 375.2 | 412.7 | ||||||||||||
| EARNINGS FROM OPERATIONS | 88.0 | 37.5 | 146.3 | 84.4 | |||||||||||
| OTHER EXPENSES | |||||||||||||||
| Finance expense | (1.0 | ) | (0.9 | ) | (3.0 | ) | (2.1 | ) | |||||||
| Foreign exchange gain (loss) | 0.8 | — | (4.1 | ) | 0.3 | ||||||||||
| Other (loss) gain | (1.9 | ) | 0.8 | (6.8 | ) | 2.5 | |||||||||
| EARNINGS BEFORE INCOME TAXES | $85.9 | $37.4 | $132.4 | $85.1 | |||||||||||
| INCOME TAXES | |||||||||||||||
| Current income tax expense | (11.6 | ) | (3.8 | ) | (20.4 | ) | (18.5 | ) | |||||||
| Deferred income tax expense | (6.4 | ) | (15.9 | ) | (44.7 | ) | (8.5 | ) | |||||||
| NET EARNINGS | $67.9 | $17.7 | $67.3 | $58.1 | |||||||||||
| Items that may be subsequently reclassified to net earnings: | |||||||||||||||
| Unrealized gain (loss) on currency hedging instruments, net of taxes | 2.5 | (0.8 | ) | (2.6 | ) | 4.2 | |||||||||
| Unrealized gain (loss) on fuel hedging instruments, net of taxes | 0.2 | — | (0.3 | ) | 0.5 | ||||||||||
| Items that will not be reclassified to net earnings: | |||||||||||||||
| Unrealized gain (loss) on equity securities, net of taxes | 7.2 | 0.3 | 13.3 | (1.0 | ) | ||||||||||
| Total other comprehensive income (loss) | $9.9 | ($0.5 | ) | $10.4 | $3.7 | ||||||||||
| COMPREHENSIVE INCOME | $77.8 | $17.2 | $77.7 | $61.8 | |||||||||||
| EARNINGS PER SHARE | |||||||||||||||
| – basic | $0.17 | $0.05 | $0.17 | $0.15 | |||||||||||
| – diluted | $0.17 | $0.04 | $0.17 | $0.15 | |||||||||||
| Weighted average number of common shares outstanding (000's) | |||||||||||||||
| – basic | 391,553 | 390,593 | 391,325 | 389,852 | |||||||||||
| – diluted | 395,641 | 394,355 | 394,948 | 393,183 | |||||||||||
Consolidated Statements of Cash Flows (Unaudited - stated in millions of | |||||||||||||||
| For three months ended | For nine months ended | ||||||||||||||
| 2020 | 2019 | 2020 | 2019 | ||||||||||||
| CASH PROVIDED BY (USED IN): | |||||||||||||||
| OPERATING ACTIVITIES | |||||||||||||||
| Net earnings for the period | |||||||||||||||
| Adjustments for items not involving cash: | |||||||||||||||
| Amortization | 43.6 | 40.1 | 107.3 | 120.8 | |||||||||||
| Foreign exchange (gain) loss | (0.8 | ) | 0.0 | 4.1 | (0.3 | ) | |||||||||
| Current income tax expense | 11.6 | 3.8 | 20.4 | 18.5 | |||||||||||
| Deferred income tax expense | 6.4 | 15.9 | 44.7 | 8.5 | |||||||||||
| Share-based compensation | 1.3 | 1.7 | 9.1 | 7.7 | |||||||||||
| Finance expense | 1.0 | 0.9 | 3.0 | 2.1 | |||||||||||
| Other items | (1.0 | ) | 0.1 | 0.5 | (4.0 | ) | |||||||||
| Changes in working capital and cash taxes | 0.8 | (12.3 | ) | (19.4 | ) | (28.8 | ) | ||||||||
| 130.8 | 67.9 | 237.0 | 182.6 | ||||||||||||
| INVESTING ACTIVITIES | |||||||||||||||
| Mineral property, plant and equipment | (54.8 | ) | (66.3 | ) | (172.7 | ) | (190.7 | ) | |||||||
| Repurchase of Island Gold royalty | — | — | (54.8 | ) | — | ||||||||||
| Other | 1.1 | (0.5 | ) | (1.2 | ) | (1.6 | ) | ||||||||
| (53.7 | ) | (66.8 | ) | (228.7 | ) | (192.3 | ) | ||||||||
| FINANCING ACTIVITIES | |||||||||||||||
| Proceeds from draw down of credit facility | — | — | 100.0 | — | |||||||||||
| Repayment of equipment financing obligations | (0.1 | ) | (0.8 | ) | (0.4 | ) | (2.6 | ) | |||||||
| Interest paid | — | — | (0.8 | ) | — | ||||||||||
| Repurchase and cancellation of common shares | — | — | (5.5 | ) | (11.4 | ) | |||||||||
| Proceeds from the exercise of options | 1.1 | 6.4 | 7.4 | 7.0 | |||||||||||
| Dividends paid | (5.4 | ) | (3.9 | ) | (16.5 | ) | (11.7 | ) | |||||||
| Proceeds from issuance of flow-through shares | — | — | — | 7.5 | |||||||||||
| (4.4 | ) | 1.7 | 84.2 | (11.2 | ) | ||||||||||
| Effect of exchange rates on cash and cash equivalents | 0.1 | (0.4 | ) | (1.2 | ) | 0.5 | |||||||||
| Net increase (decrease) in cash and cash equivalents | 72.8 | 2.4 | 91.3 | (20.4 | ) | ||||||||||
| Cash and cash equivalents - beginning of period | 201.3 | 183.2 | 182.8 | 206.0 | |||||||||||
| CASH AND CASH EQUIVALENTS - END OF PERIOD | $274.1 | $185.6 | $274.1 | $185.6 | |||||||||||
![]()
2020 GlobeNewswire, Inc., source

